How do sea surface temperature (SST) gradients reveal patterns of coastal upwelling and long-term variability? A new study, Application and Comparison of Satellite-Derived Sea Surface Temperature Gradients to Identify Seasonal and Interannual Variability off the California Coast: Preliminary Results and Future Perspectives, demonstrates the value of satellite-derived SST gradients for tracking seasonal variability and long-term trends in coastal dynamics. The findings show clear similarities across datasets, while also pointing to areas for future improvement such as higher resolution and better cloud detection.
The study is particularly relevant for two audiences: data producers of SST products and those applying SST gradients to study coastal dynamics. For both groups, the results highlight that improvements in cloud detection are critical, and that SST gradients can be effectively used to monitor changes in upwelling, a key process shaping coastal biodiversity.
Co-authors of this publication include GHRSST Science Team members Marisol Garcia-Reyes, David Wethey, Daniele Ciani, and Jose Gomes-Valdez, with lead author Jorge Vazquez-Cuervo providing insights into the study.
Motivation for this Study
Sea Surface Temperature (SST) Gradients are critical for identifying air-sea coupling and upwelling in coastal regions. Additionally with the MODIS Aqua and Terra now provide over 20 years of high resolution sea surface temperature which are critical for identifying fronts in coastal regions. Thus, a major part of the motivation was to examine the possible trends in sea surface temperature gradients as they relate to possible trends in coastal upwelling. Another motivating factor was to compare two high resolution SST products to examine possible differences and causes.
What’s New?
The comparison of the seasonality of SST gradients derived from the UK Met Office’s Operational Sea Surface Temperature and Ice Analysis (OSTIA) and NASA’s Multi-Scale Ultra-High Resolution (MUR) sea surface temperature data set. Both data sets show similar seasonality with the maxima in gradients occurring during the summer time frame, consistent with the season of maxima upwelling. Both showed increasing trends in gradients along the coast, consistent with observed increasing trends in coastal upwelling and winds. However, a major finding was also that differences do exist between the two data sets. A major difference between the two data sets is that OSTIA incorporates Geostationary data in the analysis. This would potentially increase the number of cloud free pixels. The study highlighted that more work needs to be done to examine the impact of clouds in the derivation of SST gradients in coastal regions.
Why It Matters?
Analysing and monitoring of trends in SST gradients, and thus coastal upwelling, would be critical for studying impacts to biodiversity. The work is very encouraging in highlighting the similarity of seasonal variability and trends. Thus, overall, the results show that the application of satellite derived SST gradients for monitoring changes in coastal dynamics/upwelling is very encouraging. It also indicates that future work on improvements of resolution and cloud detection are critical.
Who Benefits?
Monitoring of long period trends and operational applications of SST gradients would be extremely important for fisheries applications and integration of the products into numerical weather forecasting and other operational applications.
The Long View
The long haul perspective would be to use the results in the study to improve the quality of a coastal SST gradient product. This would include for operational purposes as well as for applications in deriving long period trends. The maps also provide the spatial variability of the SST gradients. It is obvious that SST gradients vary significantly, especially between the coastal region and further offshore.
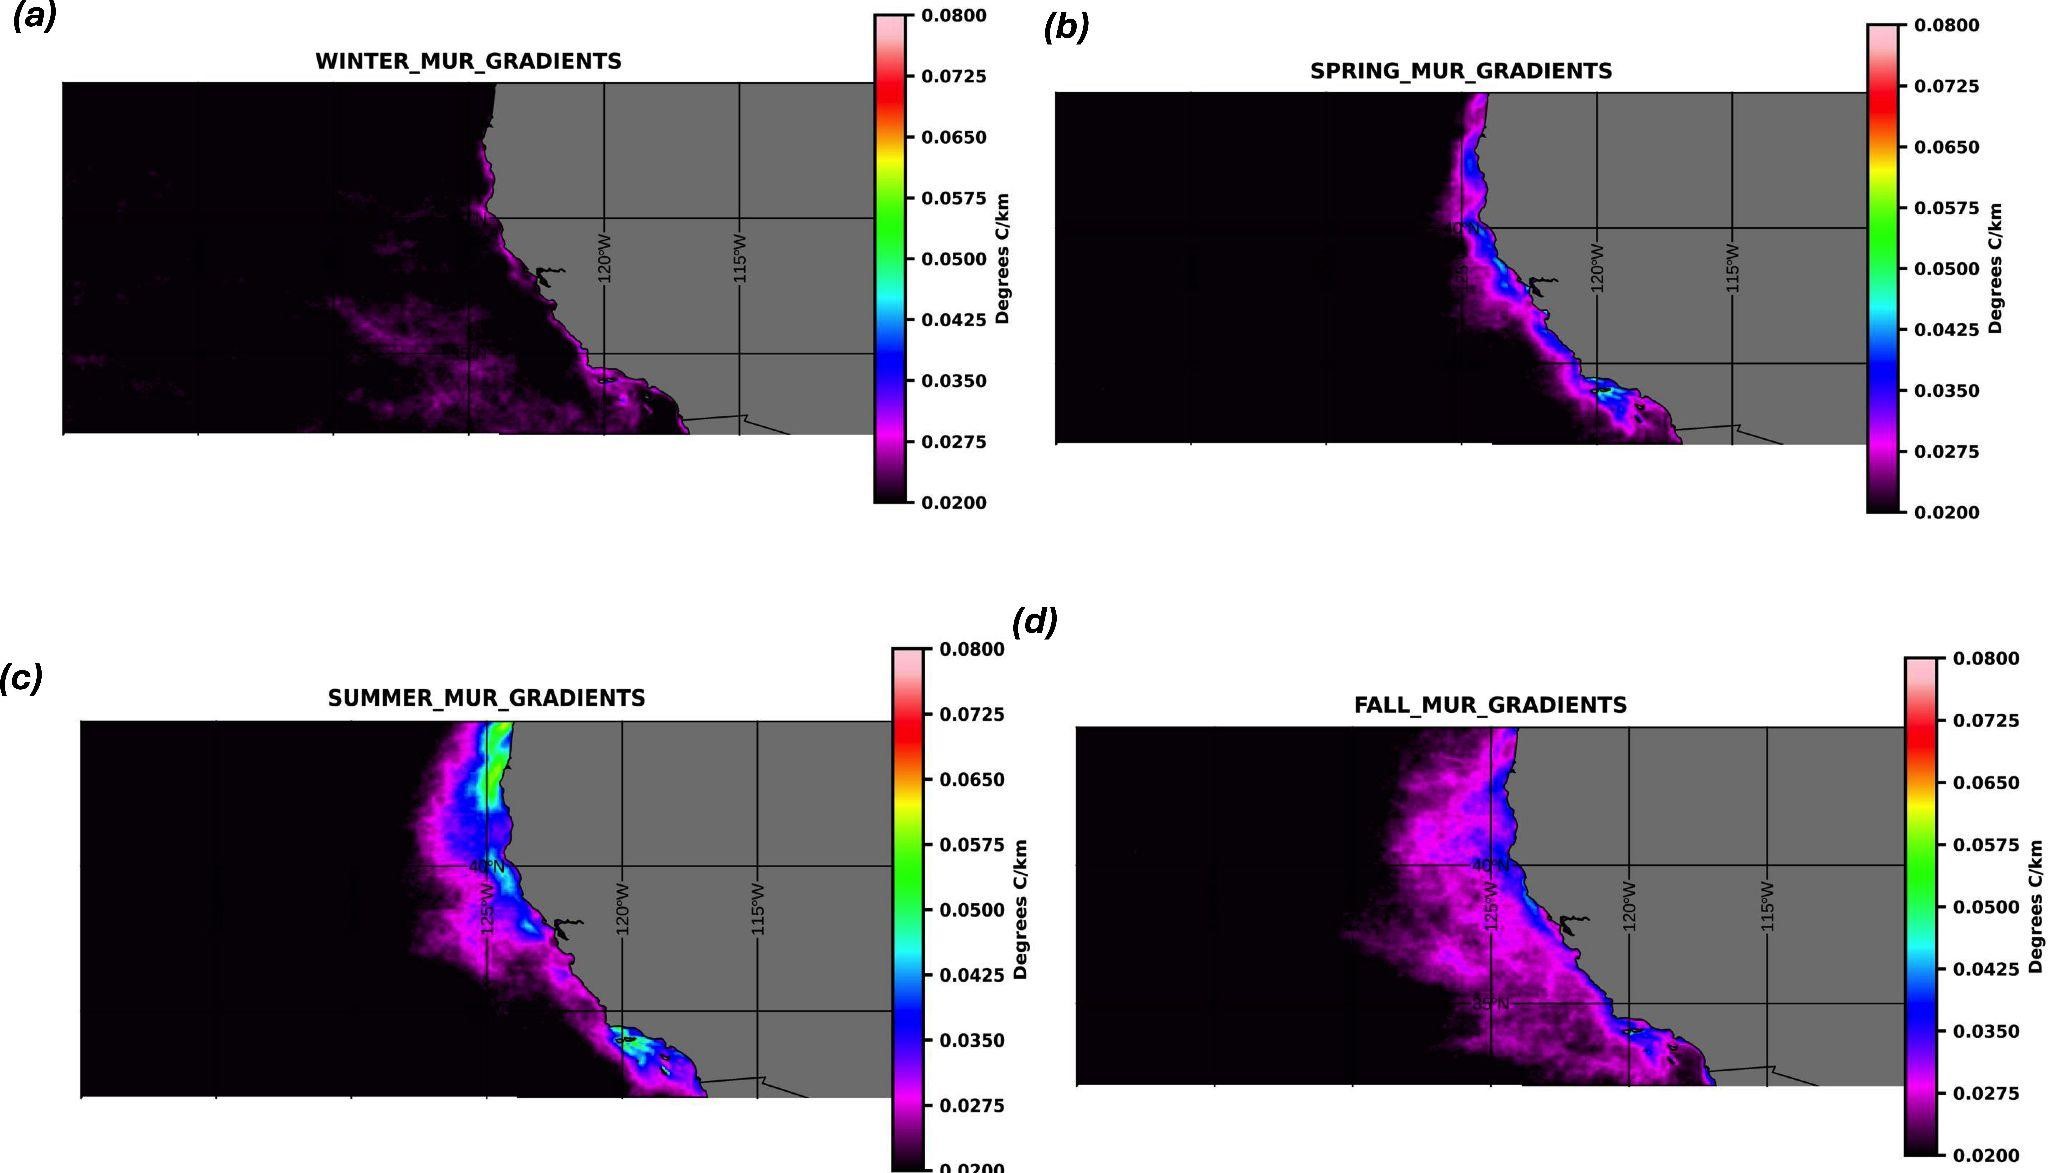
Figure 1. (a–d): MUR derived mean SST gradients for (a) winter, (b) spring, (c) summer, and (d) fall.
Read the full publication in the Special Issue on Applications of Remote Sensing in Oceanography: Prospects and Challenges to learn more.
Corresponding Author

Dr. Jorge Vazquez is a Research Scientist at NASA Jet Propulsion Laboratory/California Institute of Technology where he is part of the Project Science Team for the Physical Oceanography Distributed Active Archive Center (PO.DAAC). He holds a Bachelor of Science in Physics form the University of Miami, Master of Science in Physical Oceanography from the University of Rhode Island, and a PhD in Geological Sciences from the University of Southern California. As a post-doc, Dr. Jorge Vazquez recounts his experience as a visiting scientist at the Institute of Marine Science in Barcelona, Spain as a time where many doors were opened up to collaboration with his Spanish colleagues, which have continued up to this day.
Professionally, Dr. Jorge Vazquez has a background as a research scientist focusing on the application of Remote Sensing in Earth Science. His research interest and expertise fall within the application of Remote Sensing to Coastal Regions and the Arctic.
Dr. Jorge Vazquez is a long-standing member of the GHRSST Community. He has been involved since the very beginning of GHRSST, through being active in sea surface temperature derived from satellites. GHRSST thus became the perfect way to create an international group focused on SST derivation and applications using satellites. As a science team member since the creation of GHRSST, Dr. Jorge has been a key part of the team behind the formulation of data interoperbaility standards. These contributions stand out as a key benefit that he has gained, stating that, “GHRSST has really set the standard for interoperbaility of data. This has now expanded in all different ways to other data sets and now to the cloud transition”. Dr. Jorge says he has also benefitted from the collaboration and coordinating distribution of GHRSST data and understanding data distribution and management issues.
Over his many years in the GHRSST Community, Dr. Jorge Vazquez has many memorable experiences and significant acheivements. He recalls, “A major breakthrough was coordinating efforts to make all SST products operational. the decision, through the GDS, to have a GHRSST compliant format for all products was a huge breakthrough”.
Get in touch with Dr. Jorge Vazquez at jorge.vazquez@jpl.nasa.gov.